

The third aerodynamic aspect is the interference of the rotor wings. Each wing has its own vorticity, which impacts on the base flow of other wings. This changing in the base flow of other wings changes their lift forces. And this changing of lift forces is reflected in a change in that vorticity. And so, there are loops with mutual dependences. The final correct distribution of airflow over the wings permits the correct selection of the aerodynamic coefficients and aggregations to obtain the correct distribution of the forces and moments.
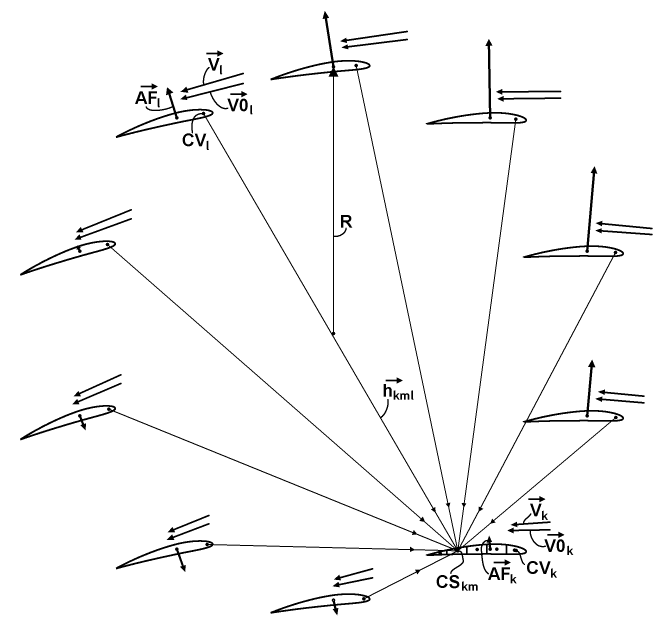
To model this aspect, I divided each of the N wings into M segments along its chord. It permits to define the elementary influence of all vorticities from all other (foreign) wings on such a segment, as explained in the chart above. The chart depicts the wings of the rotor with a typical distribution of the aerodynamic forces AF, the base flow speed vectors V0 and the actual speed vectors V. These V0 vectors already have the inflow included, and these V vectors are simply the individual LASs of the related wings. Each wing also has its own center of vorticity CV. The wing with the index "k" is a current destined wing. Its m-th segment receives a superposition of induced speeds from the CVs of all other wings, where the wing with the index "l" is a current source wing. The radius-vector from the l-th CV toward the center CS of the m-th segment of the k-th wing is referenced as an h-vector with a combination of indices "kml".
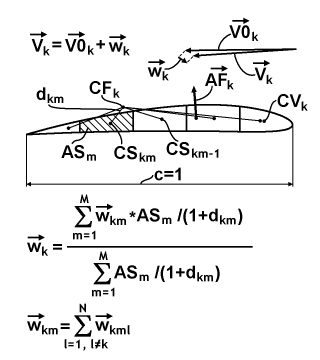
The chart above represents a magnified k-th wing from the previous chart and explains how induced speeds "w" from all segments of the wing contribute to the common induced speed. I reference this as a consolidation of the interference induced speed vector, over the entire wing. For this consolidation, I simply use the weighting formula, which is provided below the shape of this wing. The weighting parameter in this formula is the ratio of the area AS of a particular segment "m" to the sum of the distance to the center of aerodynamic force CF for the k-th wing and the chord length equal to 1 upon normalization. All constituents of the consolidation formula are depicted and defined in the chart. And at the bottom of the chart, a simple superposition formula is represented for calculating the induced speed in this segment. On the up, a simple formula provides the result for the k-th V-vector.
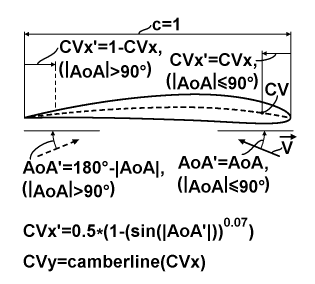
The chart above explains the calculation of the position of the center of vorticity (CVx;CVy) on the wing depending on the AoA. The center of vorticity itself doesn't actually exist, since the general symmetry of the vorticity distribution is too complicated for that. And so, it is only an approximation. At first, I find the main AoA', which is equal to AoA for the first and fourth quadrants of the angular space and is equal to 180°-|AoA| for others. After that, I find the main CVx' value from the first empirical formula at the bottom of the chart. And the resulted CVx will be equal to the CVx' for the first and fourth quadrants and will be equal to 1-CVx' for others. The CVy is calculated simply as the y-coordinate of the camber-line of the used airfoil for the CVx coordinate. This approximation simply reflects the fact that the vorticity is concentrated in the direction of the corresponding leading edge of the airfoil for high values of AoAs.
The center of vorticity and counter-parted centers of the segments aren't points. They can be considered as linear segments with wing length L, with presumed flat distribution equal to the vorticity distribution from sources with an equalized load distribution, having the same average load as the actual wing. So there is a need for some specific formula, based on proper integration on both sides for calculating the elementary value of the induced speed. The chart below explains deducing of such a formula.
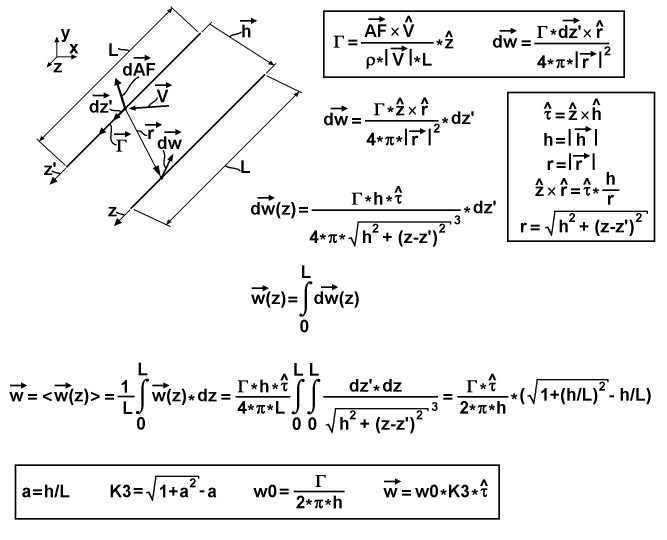
It has in the upper-left corner a 3-d chart that depicts a linear vorticity source and a linear center of the destined segment. Both of these linear elements are oriented in the z-direction. The y-direction is up and the x-direction to the right. The z-coordinate on the sourcing segment is denoted by z', and for the destined segment, simple by z, to separate the different integration variables. Vector-h from the first chart is also represented there. The chart depicts an infinitesimal inducing action of the speed from some subsegment of the sourcing segment to some subsegment of the destined segment. The length of the sourcing subsegment is the spatial differential dz', and the length of the destined - dz. The sourcing subsegment possesses some differential value of aerodynamic force as a vector-dAF oriented perpendicular to this segment, and some value of circulation as a vector-Γ oriented along this segment, where both are induced by the speed vector-V of this segment. These two differential subsegments are connected by an r-vector. On the destined subsegment an induced differential-speed vector-dw exists, which is perpendicular to the r-vector and the destined segment. On the upper-right side of the explanatory chart two base equations are referenced in a common frame. The first is the reversed formulation of the Joukowski theorem for the case of equally loaded wing, which relates the signed scalar circulation Γ with the cross-product of the entire aerodynamic force AF and the vector-V. The second equation in this frame is the Biot-Savart law for induced speed, which relates its differential with the cross-product of the vector-dz' and the vector-r, scaled by this circulation. Below the frame, the Biot-Savart law is expressed, which is reorganized to have the scalar differential dz' on its right side. The frame at the middle-right side of the chart introduces a normalized τ-vector, which is the cross-product of the normalized z-vector and the normalized h-vector, and it is simply the direction of the dw-vector. Also, this frame contains simplified notation for the magnitudes of the h and r vectors as just h and r, an expression for the cross-product of the normalized z-vector and normalized r-vector that utilizes the normalized τ-vector and the ratio of h to r, and an expression for the r as a function of z and z'. The last two expressions are substituted in the equation for the vector-dw from the first line outside of the frame, the result of which is represented in the second line as a function of z. The third line has a simple expression for integrating of the z-functional differential dw over the entire length of the sourcing segment. The forth line expresses the resulting elementary vector-w of the induced speed as a result of averaging the spatial distribution of the induced speed vector over all length of the destined segment. So, after substituting the first integral, there is a double integral expression, which was reduced to a simple algebraic formula for resolving these two integrals, using the tables of integrals. Finally, the frame at the bottom of the chart contains the chained form of this formula, which is more convenient for calculation. At first, there is a 3-d aspect coefficient "a" equal to the ratio of h to L. At second, there is a 3-d factor coefficient K3 expressed from this "a". At third, there is a maximal magnitude w0 of the induced speed, expressed through the entire circulation Γ and the distance h between segments. And fourth, there is a resulted vector-w expressed as the product of w0, K3 and the normalized τ-vector.
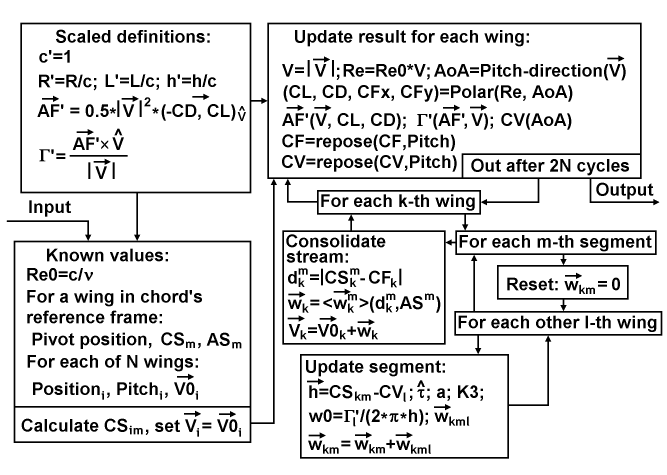
The diagram above represents the data flow and definitions for calculating the state of the interference corrected airflow of the entire rotor. To simplify this process, I use unit-based scaling of its constituents for the values of the wing chord, air density, and wing area. But the airspeed is used in absolute units. At first, there are scaled definitions, where each scaled component has a prime sign ('), including the chord itself, the radius of the rotor, the length of the wings, the distances between the source and destination segments, the aerodynamic force formulation, and the circulation formulation, where the last uses a two-dimensional scalar version of the cross-product. At second, there is an input setup of the known values, which includes the Reynolds number Re0=c/ν, normalized in speed, the common and constant properties of the pivot and segments, and the distributions over the wings for positions, pitches and base flows. And this setup is finalized by calculating the spatial distribution of the centers of segments and by setting the initial distribution of the airspeeds equal to the respective base flows. After this setup, the main cycle for updating result of each wing begins. It includes calculation of the speed's magnitude, Reynolds number and AoA, Polar querying of aerodynamic coefficients and aggregations, calculation of the scaled aerodynamic force and circulation, calculation of the center of vorticity relative to the chord, and reposition of CF and CV relative to the rotor's origin, which is located in the center of the rotor. After 2N cycles of this updating, the completed result passes to the output. In another case, the updating cycle continues by updating the distribution of the airspeeds themselves, starting with the walkthrough over the destined wings. This walkthrough begins with the walkthrough over the segments, which begins with the reset of the related induced speed to zero and continues with the walkthrough over the foreign sourcing wings. The last walkthrough performs the incremental update of the current segment, which includes: calculating the radius-vector from the current CV to the current CS, calculating the direction of the induced speed, calculating the 3-d aspect coefficient, calculating the 3-d factor coefficient, calculation of the maximal magnitude of the induced speed, calculating the induced speed itself and accumulating the induced speed in the current segment. After this, the last walkthrough continues. After this walkthrough is finalized, the process returns to continue the walkthrough for the next segment. After the walkthrough over the segments is finalized, the process goes to the consolidating the stream for the current destined wing. This consolidating uses the formulation referenced in the second chart (But here I use the tensorial notation for compactness), which is finalized with updating the airspeed of the current destined wing. The consolidating returns to continuing the walkthrough over the destined wings. The walkthrough over the destined wings is finished with the initiation of the next main cycle for updating the result.
Copyright © 2018-2023 Yuri Feldman - All Rights Reserved